Bitcoin Rainbow Chart predicts BTC price for July 1, 2026
The Bitcoin Rainbow Chart prediction suggests the cryptocurrency could trade between $99,143 and $1.16 million by July 1, 2026, depending … Continue reading The post Bitcoin Rainbow Chart predicts BTC price for July 1, 2026 appeared first on Finbold.
The Bitcoin Rainbow Chart prediction suggests the cryptocurrency could trade between $99,143 and $1.16 million by July 1, 2026, depending on which valuation band Bitcoin (BTC) occupies within the model. With Bitcoin trading at round $64,500 on June 14, the long-term valuation model places BTC below even the lowest projected Rainbow Chart level for July 2026.
Rather than forecasting an exact price target, the chart uses a logarithmic growth curve to determine whether Bitcoin is historically undervalued, fairly valued, or overvalued. According to the model, the lowest ‘Fire Sale!’ band sits at $99,143 and represents extreme undervaluation.
The ‘BUY!’ band is projected at $134,755, followed by ‘Accumulate’ at $184,990 and ‘Still Cheap’ at $249,738, all of which suggest Bitcoin remains undervalued relative to its long-term trend. Bitcoin Rainbow Chart.
Source: CoinGlass The ‘HODL’ band is projected at $337,147 and is generally considered fair-value territory. Above that, the ‘Is this a bubble?’ band stands at $463,190, while ‘FOMO Intensifies’ is projected at $637,764, reflecting growing speculative demand.
The model’s highest valuation zones are Sell. Seriously, sell! at $856,171 and Maximum Bubble Territory at $1,164,644, levels historically associated with overheated market conditions.
At its current price, Bitcoin remains about 53.5% below the projected ‘Fire Sale!’ level for July 2026.
Reaching the model’s fair-value ‘HODL’ band would require a gain of roughly 422%, while a move into ‘Maximum Bubble Territory’ would imply upside of more than 1,700%. Notably, the Rainbow Chart is widely used as a long-term Bitcoin valuation model because it places price action within the context of previous market cycles, helping identify periods of undervaluation and overvaluation rather than predict precise future prices. Bitcoin price analysis chart By press time, Bitcoin was trading at $64,587, up about 1% over the past 24 hours and more than 3% on the week.
Bitcoin seven-day pr
Đọc thêm từ Tiền số / Crypto

World Cup matches face delays as Scotland vs. Haiti kicks off late
Frequent delays due to weather could disrupt broadcast schedules, betting markets, and fan engagement, impacting the tournament's financial ecosystem. The post World Cup matches face delays as Scotland vs. Haiti kicks off late appeared first on Crypto Briefing.

US government confident in peace deal with Iran, says Ambassador Waltz
A potential US-Iran peace deal could stabilize geopolitical tensions, impacting global markets and reducing risk premiums, but uncertainty remains. The post US government confident in peace deal with Iran, says Ambassador Waltz appeared first on Crypto Briefing.

BetBoom Team faces Team Vitality for IEM Cologne Major playoff spot
The shift away from crypto sponsorships at IEM Cologne Major signals a potential reevaluation of funding strategies in esports. The post BetBoom Team faces Team Vitality for IEM Cologne Major playoff spot appeared first on Crypto Briefing.
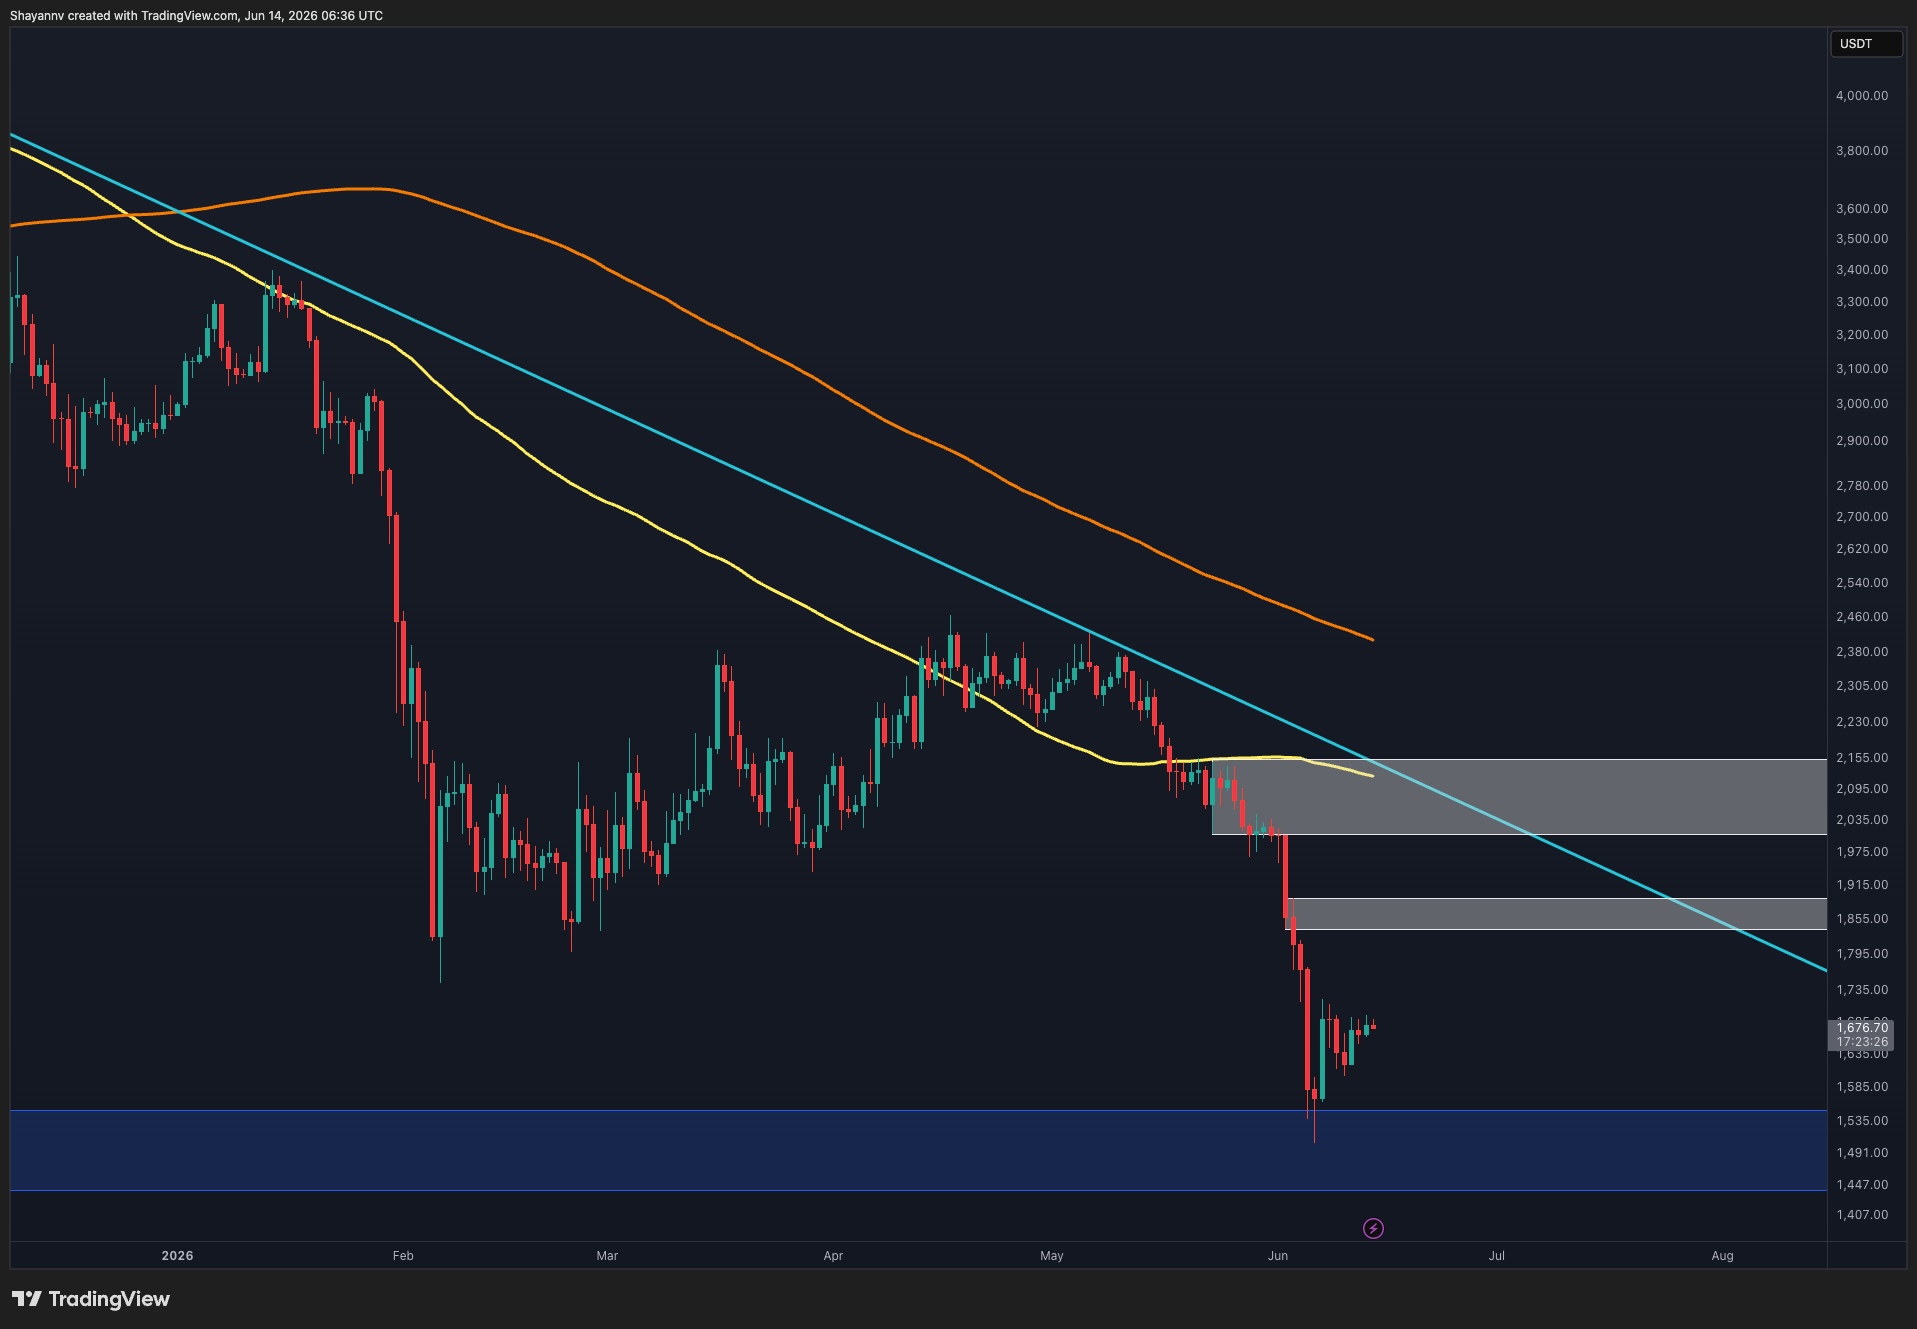
Ethereum Price Analysis: ETH Must Reclaim These Key Levels Before a Run to $2K
Ethereum’s latest rebound remains corrective so far, with the price still trading below key supply zones after stabilizing near the lower support area. Further consolidation is expected for the coming week. Ethereum Price Analysis: The Daily Chart On the daily timeframe, ETH is c