Bitcoin Price Analysis: Is BTC Ready for Another Leg Higher Next Week?
Bitcoin has staged a notable rebound after sweeping liquidity beneath the June lows, but the recovery is now approaching a critical resistance cluster. While momentum has improved in the short term, the broader structure remains bearish until BTC reclaims several major resistance
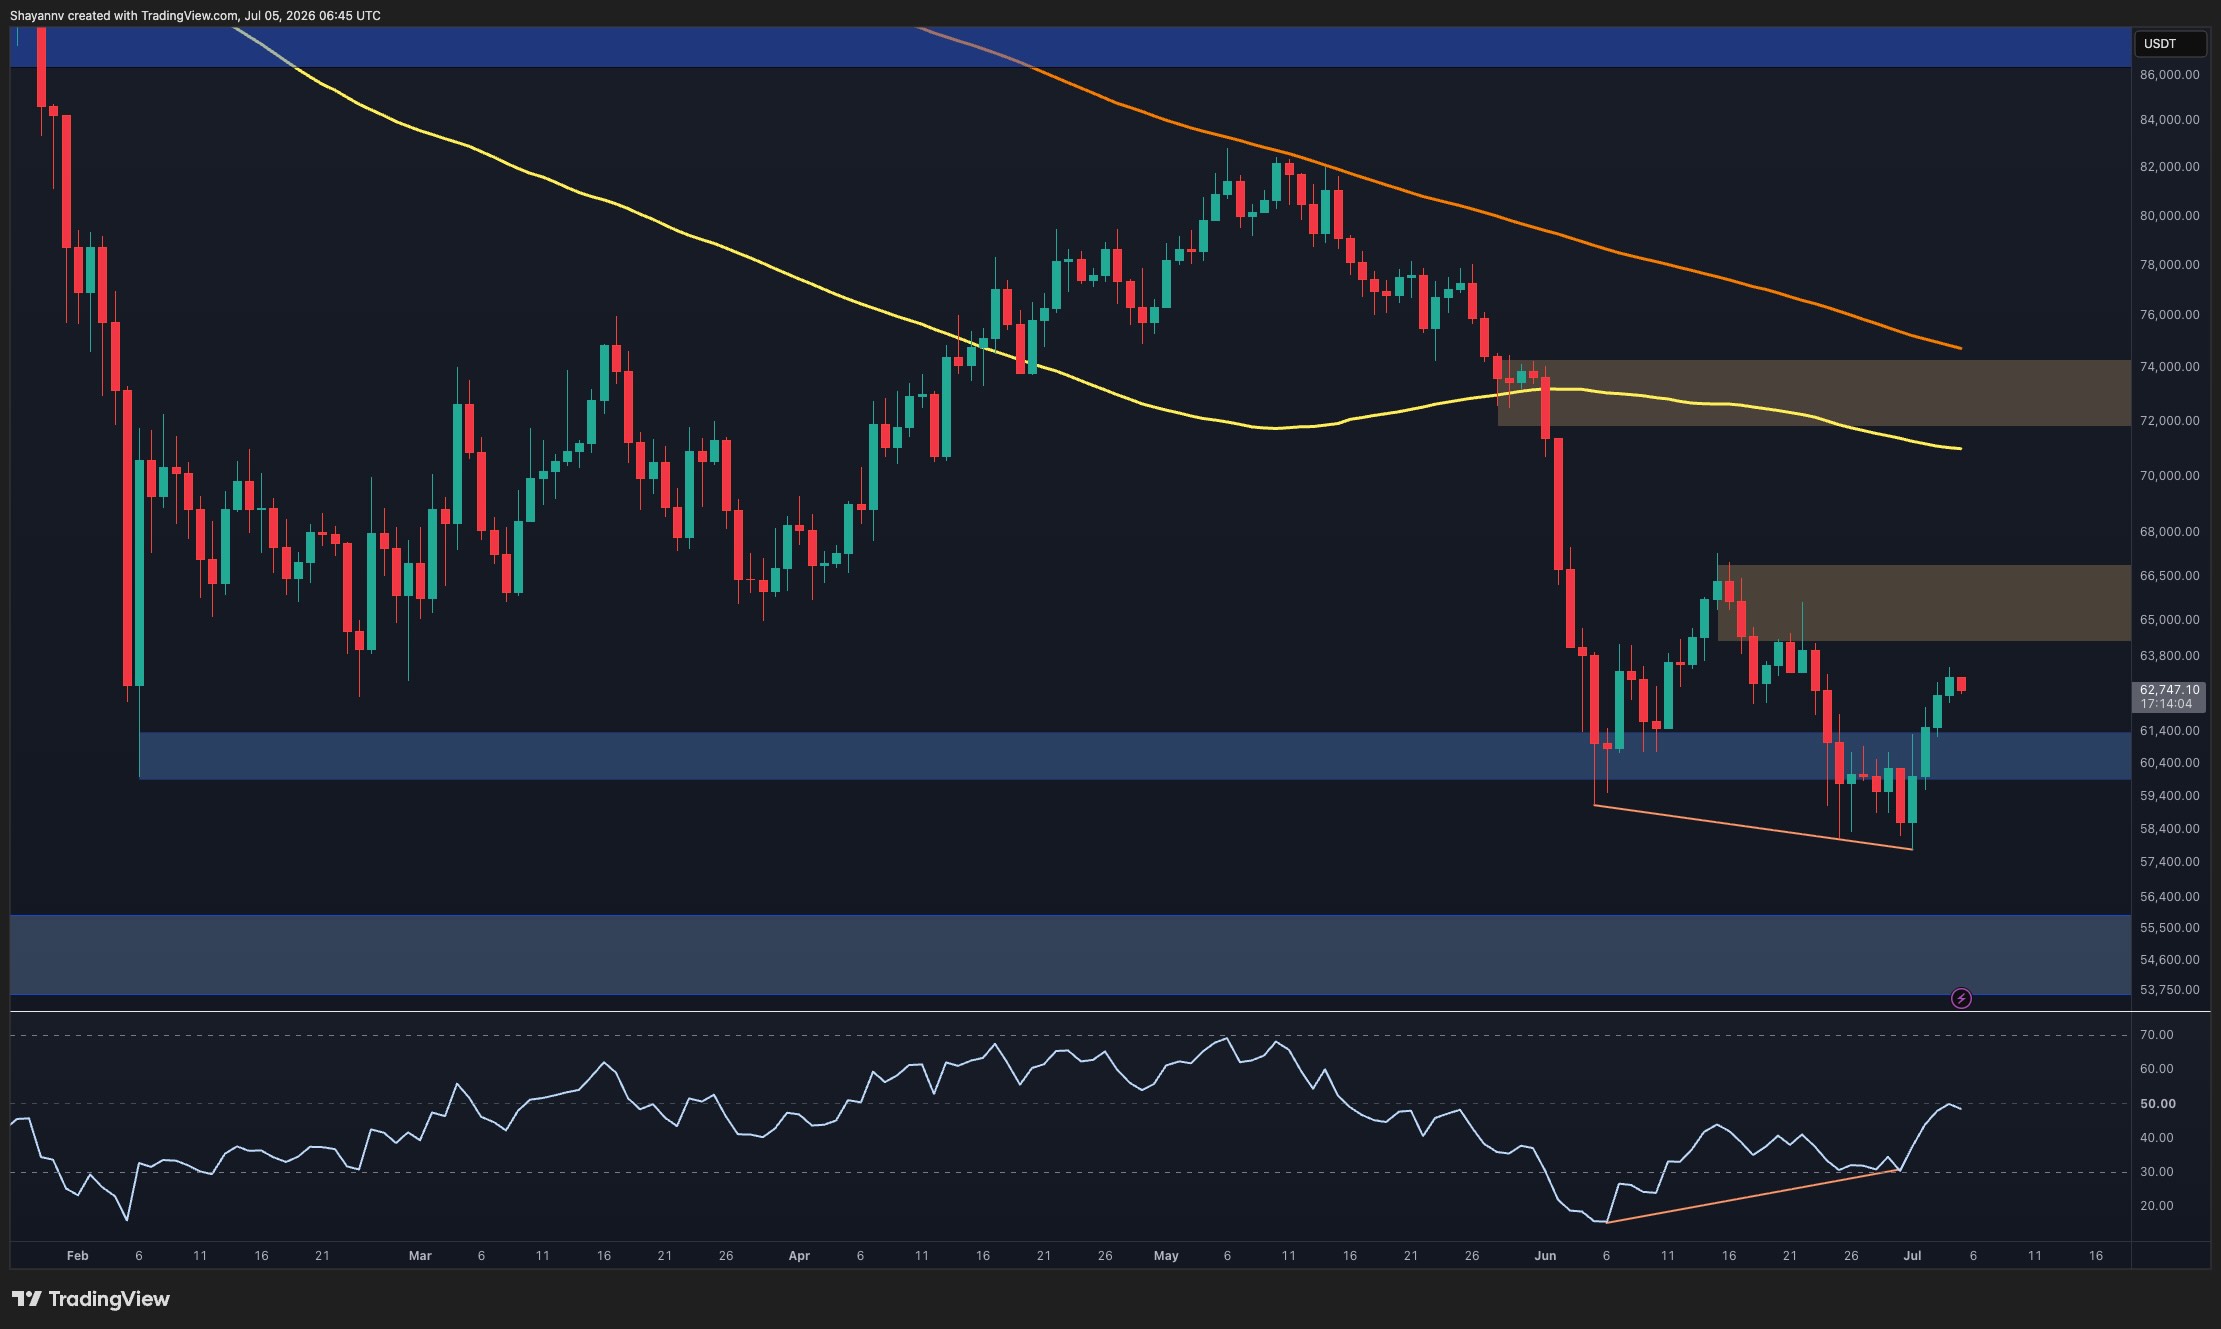
Bitcoin has staged a notable rebound after sweeping liquidity beneath the June lows, but the recovery is now approaching a critical resistance cluster. While momentum has improved in the short term, the broader structure remains bearish until BTC reclaims several major resistance levels overhead. Bitcoin Price Analysis: The Daily Chart The daily timeframe shows Bitcoin continuing to trade below its key moving averages, with both the 100-day and 200-day moving averages sloping lower and acting as dynamic resistance.
The market remains structurally bearish after losing the $72K-$74K support zone in June, which has now flipped into a major supply area. However, the recent price action is becoming more constructive. BTC successfully defended the $58K-$61K support region and produced a sharp bounce from the lower boundary of the broader descending structure.
More importantly, the daily RSI has formed a bullish divergence, with momentum making higher lows while the price registered comparable or lower lows around the June bottom. This divergence often appears during exhaustion phases and suggests selling pressure has been weakening despite the downtrend. The immediate challenge lies around $65K-$67K, where a major resistance zone intersects with the descending upper trendline.
A successful breakout above this area would likely trigger a larger recovery toward the former breakdown region near $72K-$74K. Conversely, rejection from the current resistance cluster would reinforce the prevailing bearish structure and increase the probability of another move toward the $60K support area. BTC/USDT 4-Hour Chart The 4-hour chart highlights a developing falling wedge structure.
Bitcoin recently rebounded from the lower boundary near $58K and has advanced steadily toward the upper trendline, which currently converges with the $63K-$64K area. The recovery has already reclaimed the $60K-$61K support zone, turning it back into a short-term demand area. Price is now testing the upper bou
Đọc thêm từ Tiền số / Crypto

World Cup 2026 is becoming crypto’s biggest stage, from fan tokens to FIFA’s Avalanche play
The integration of crypto in World Cup 2026 could redefine fan engagement and blockchain's role in global sports events. The post World Cup 2026 is becoming crypto’s biggest stage, from fan tokens to FIFA’s Avalanche play appeared first on Crypto Briefing.

Iranians gather for second day to mourn Khamenei amid leadership transition
The leadership transition in Iran may affect regional stability and market perceptions, with potential shifts in diplomatic and military dynamics. The post Iranians gather for second day to mourn Khamenei amid leadership transition appeared first on Crypto Briefing.

FIFA’s 2026 World Cup gets its crypto moment as fan tokens surge and Kraken enters the pitch
The 2026 World Cup's crypto integration signals a shift towards mainstream adoption, potentially reshaping digital asset markets and fan engagement. The post FIFA’s 2026 World Cup gets its crypto moment as fan tokens surge and Kraken enters the pitch appeared first on Crypto Brie

Bull Market in Sight: Bitwise Sees Bottom Forming Ahead of Fall Rally
Bitcoin holds above $60,000 as Bitwise CIO says Strategy-led leverage unwind may signal a market bottom ahead of a fall bull run. STRC and Late-Cycle Stress Bitwise Chief Investment Officer Matt Hougan explained in a July 1 analysis that STRC, Strategy’s perpetual preferred equit