Bitcoin Price Analysis: Here’s BTC’s Most Likely Path This Week
After Bitcoin’s decisive breakdown from a multi-month rising channel, the largest crypto is still under immense pressure. While buyers managed to defend the $60K support region and trigger a short-term rebound, the broader structure still favors the sellers unless BTC can reclaim
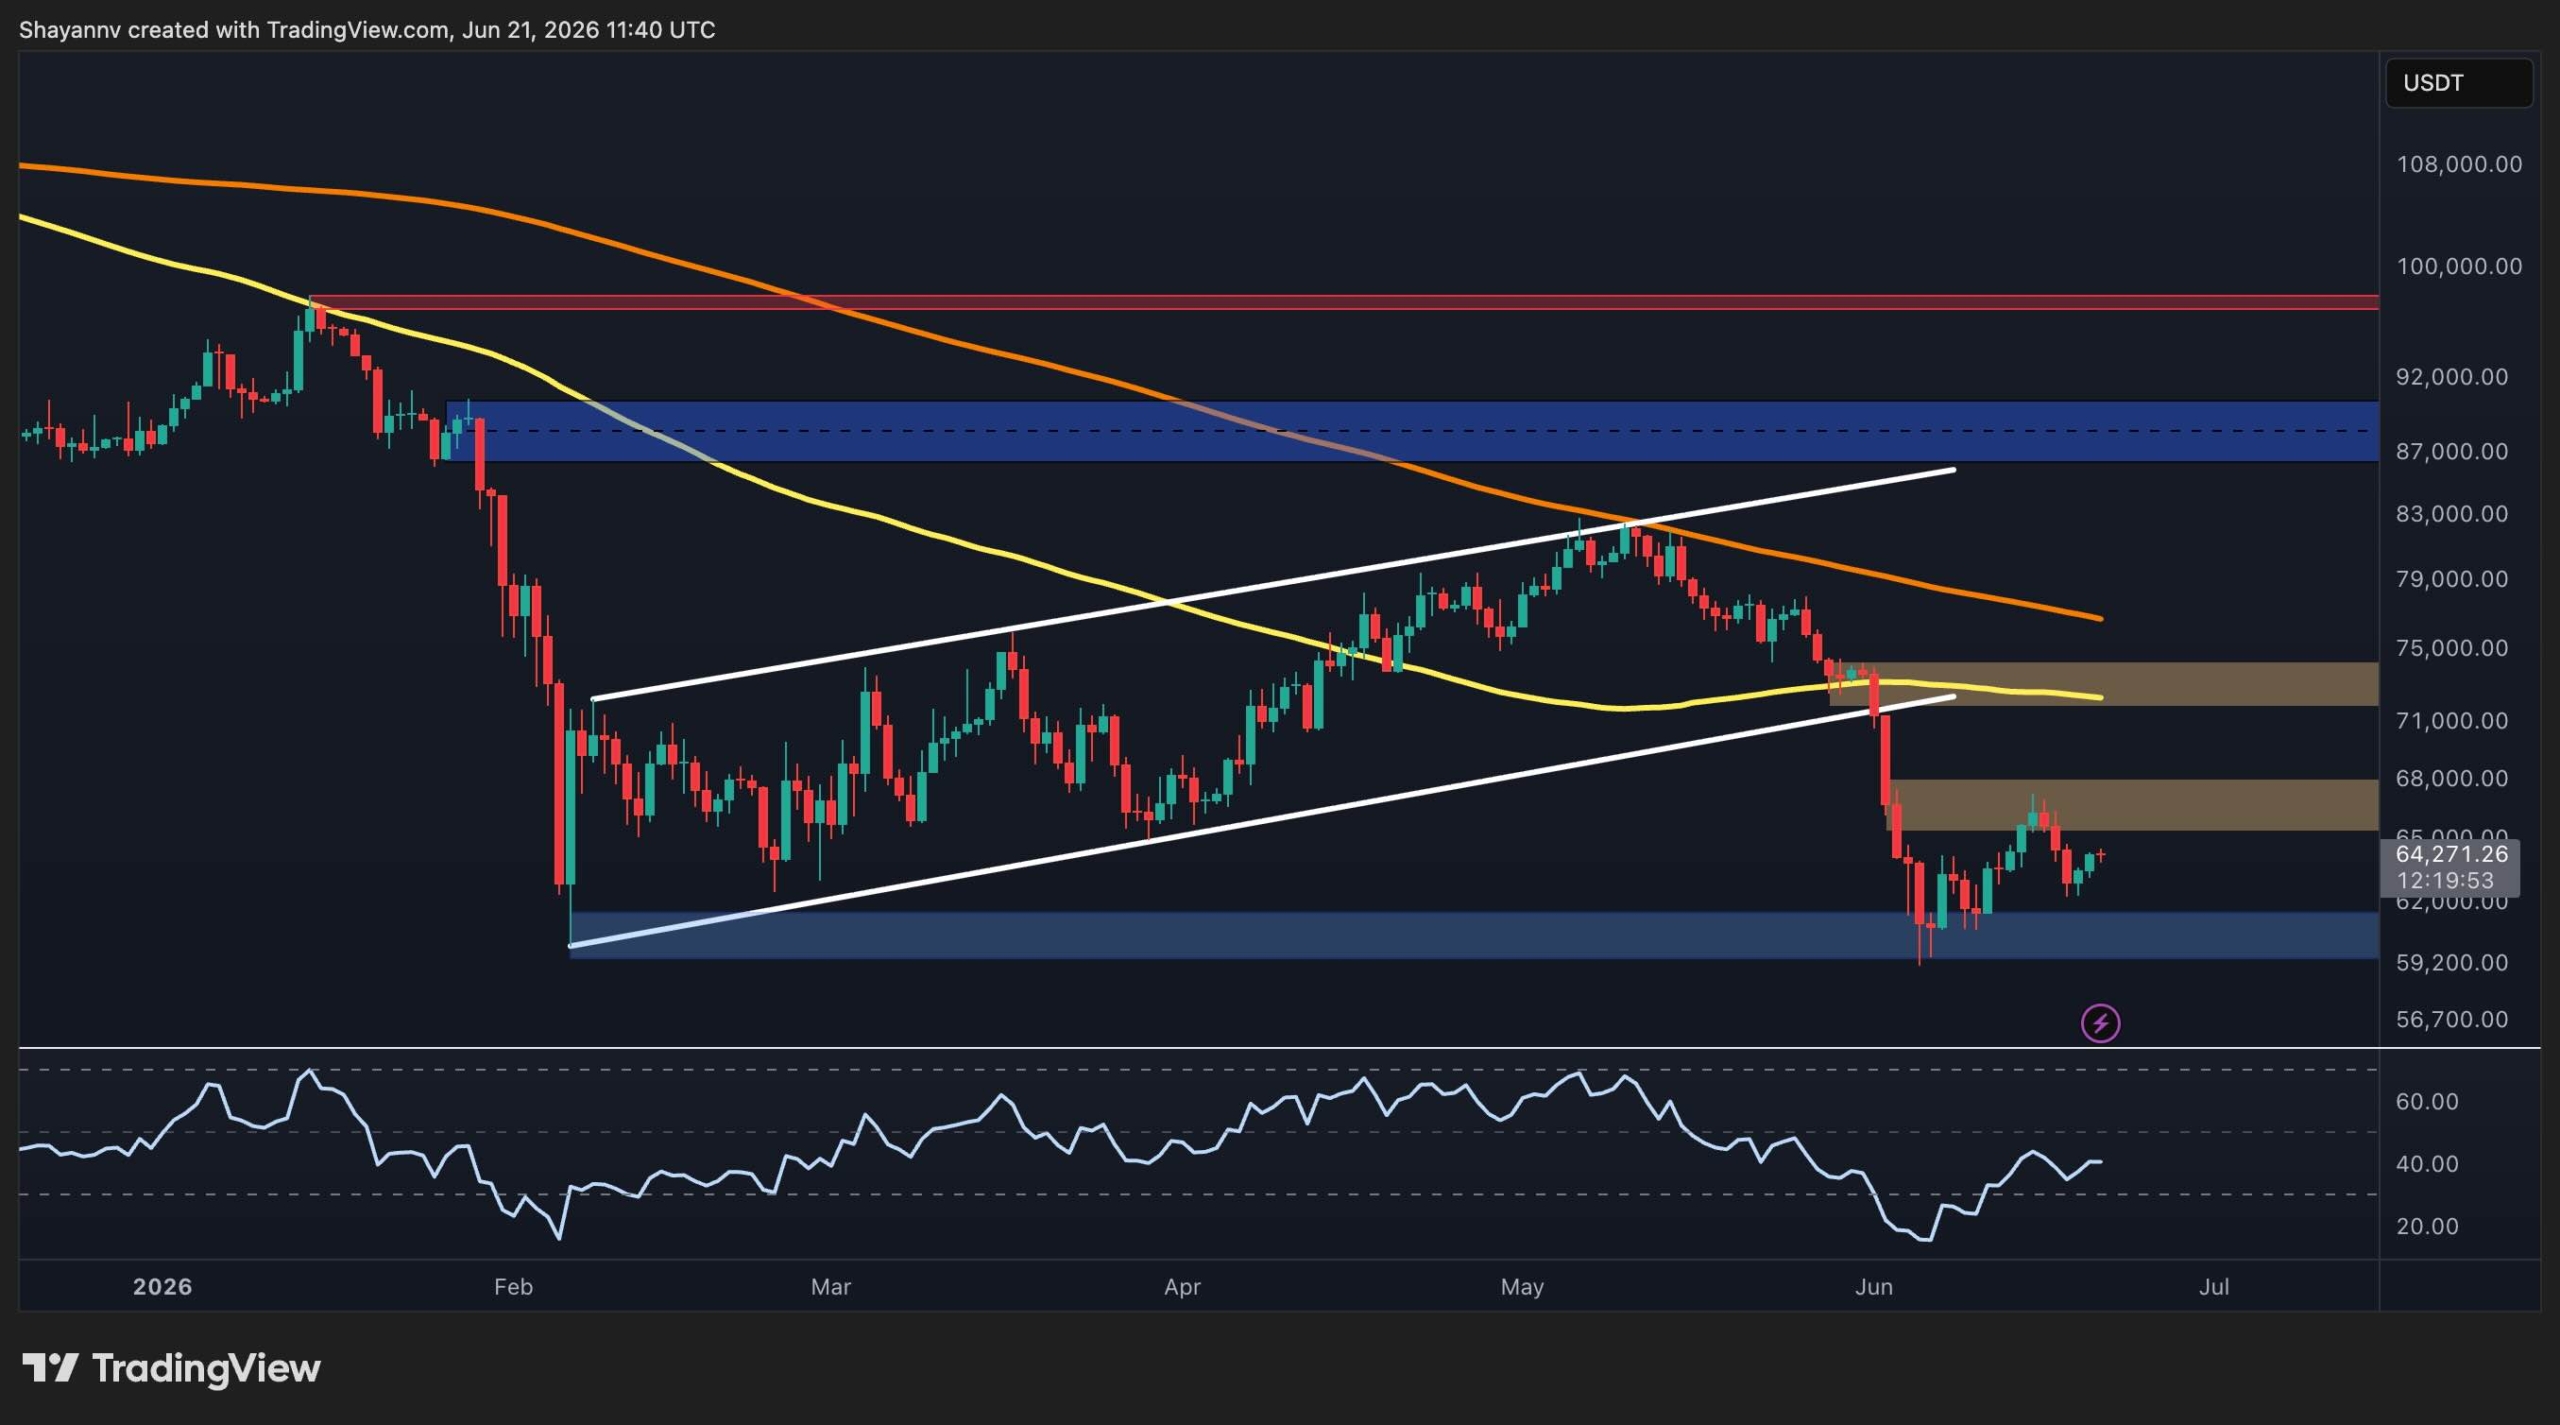
After Bitcoin’s decisive breakdown from a multi-month rising channel, the largest crypto is still under immense pressure. While buyers managed to defend the $60K support region and trigger a short-term rebound, the broader structure still favors the sellers unless BTC can reclaim several important resistance levels overhead. Bitcoin Price Analysis: The Daily Chart On the daily timeframe, BTC recently confirmed a bearish breakdown below a large ascending channel, accelerating selling pressure and pushing the asset toward the major support zone around $60K, where buyers stepped in and halted the downtrend.
The selloff also drove Bitcoin well below both the 100-day and 200-day moving averages. These MAs are currently positioned around $72K and $76K, respectively. The loss of the 100-day moving average, which was supposed to act as a dynamic support level, signals a significant deterioration in the broader market structure and suggests that sellers continue to control the trend.
Following the sharp decline, BTC found demand near $60K and staged a modest recovery toward the $64K region. However, the rebound remains relatively weak compared to the magnitude of the preceding drop. The first major resistance now sits between $65K and $68K, where a previous support area has turned into supply.
Above that, the more critical resistance zone is located around $72K to $75K, which coincides with the 100-day moving average and the lower boundary of the broken ascending channel. A successful reclaim of this area would be the first indication that the recent breakdown may have been a bear trap. On the downside, the $60K region remains the most important support level.
Losing this zone could expose Bitcoin to a deeper correction toward lower liquidity clusters and potentially trigger another wave of capitulation. BTC/USDT 4-Hour Chart The 4-hour timeframe provides a clearer view of the recent breakdown and subsequent consolidation phase. After losing the $72K to $74K support zone, BT
Đọc thêm từ Tiền số / Crypto

Polymarket paid creators to stage fake winning bets on dummy sites: WSJ
The Journal reviewed more than 1,100 videos and found none of the roughly $1.9 million in bets shown in influencer-produced hype videos were real.

China Trims US Treasury Holdings to $651.1 Billion, Hitting an 18-Year Low
According to official data from the U.S. Treasury Department, China’s stash of treasuries fell to $651.1 billion in April, the lowest level recorded since September 2008. Nonetheless, foreign ownership of U.S. debt increased during the same period, with Japan and the U.K. increas

$165 Billion Stock Selloff Looms as Goldman Flags Rising Leverage
JPMorgan flags a $165 billion stock selloff into month-end as Goldman data shows hedge fund leverage near multi-year highs. The post $165 Billion Stock Selloff Looms as Goldman Flags Rising Leverage appeared first on BeInCrypto.

Russell 2000 unprofitable stocks surge 60%, outpacing profitable firms in speculative rally
The speculative surge in unprofitable stocks highlights market risk appetite, potentially signaling a shift in investor focus from quality to growth. The post Russell 2000 unprofitable stocks surge 60%, outpacing profitable firms in speculative rally appeared first on Crypto Brie